visualization gallery
Area chart
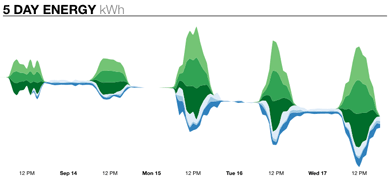
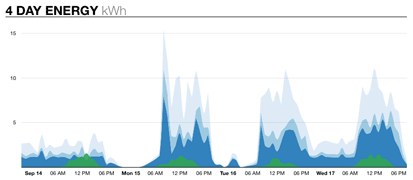
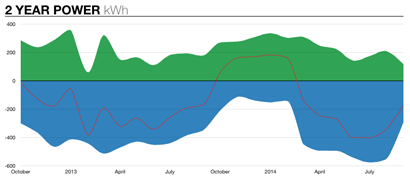
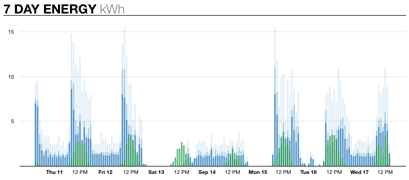
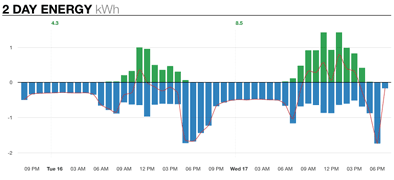
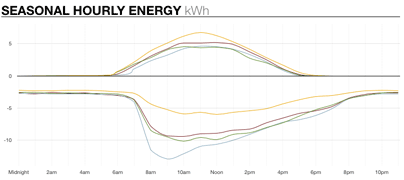
An area chart to show power over time for one or more groups of data streams stacked together. The chart supports a traditional mode and a wiggle mode that can help visualize the relative changes of many data streams.
This is useful for answering questions like:
- How can I quickly understand when I am using or generating power?